The graph shows the sales, in thousands of dollars, for a small business over a twelve month period. Use the graph to answer the question. 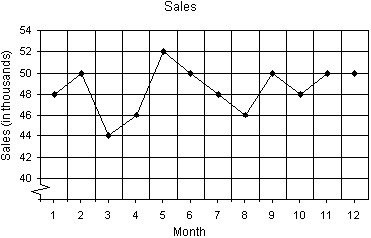 In what month(s) were sales $48,000?
A. Month 1, Month 7, Month 10
B. Month 4, Month 8
C. Month 1, Month 8, Month 10
D. Month 7, Month 10
Answer: A
Mathematics
You might also like to view...
Find the smallest value of N that will make the inequality hold for all n > N. < 10-3
A. 1612 B. 1605 C. 1607 D. 1609
Mathematics
For the given angle in standard position, designate the quadrant in which the terminal side lies.339°
A. II B. IV C. III D. I
Mathematics
The figure shows an angle ? in standard position with its terminal side intersecting the unit circle. Evaluate the indicated circular function value of ?.Find csc ?.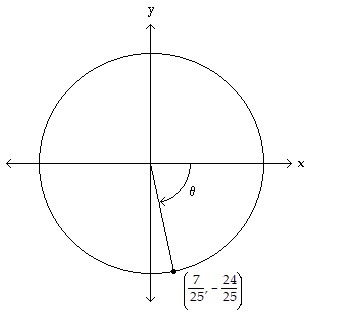
A. - 
B. 
C. 
D. - 
Mathematics
Graph the inequality.-3x - 5y ? 15
A. 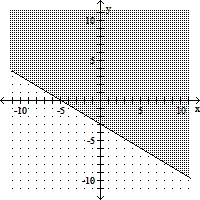
B. 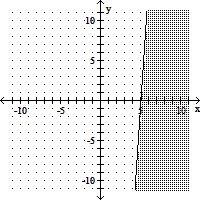
C. 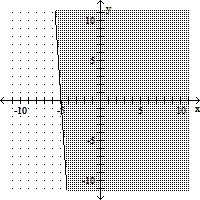
D. 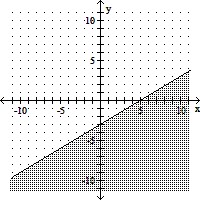
Mathematics