Refer to the data in the table below. Which of the following statements is correct?
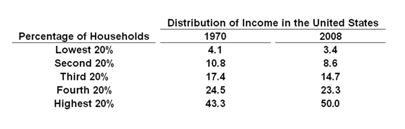
A. The distribution of income was the same in 2008 as in 1970
B. In 2008, the top 20 percent of households earned about half of the nation's total income
C. In 1970, the poorest 60 percent of the population earned 17.4 percent of the nation's total income
D. The income levels of the lower 60% of households have fallen from 1970 to 2008
B. In 2008, the top 20 percent of households earned about half of the nation's total income
You might also like to view...
Sarah consumes pizzas and hamburgers. The price of a hamburger is $1 and the marginal utility from her last hamburger is 5. Let Pp be the price of a pizza and MUp be the marginal utility of pizzas
In consumer equilibrium, the ratio MUp/Pp for Sarah's last pizza must equal A) 0.2. B) 1.0. C) 5.0. D) infinity.
What is the distinction between nominal GDP and real GDP?
What will be an ideal response?
Which of the following correctly explain Ricardian equivalence?
a. Government spending that is financed by borrowing has a smaller effect on the economy than government spending financed by raising taxes. b. Consumers do not base current spending on future expected tax liabilities. c. Government borrowing can function like increased current taxes, reducing current household and business expenditures. d. The government should balance its budget by equating revenue and expenditure in every fiscal year. e. Government spending does not crowd out private investment.
If the economy was operating at point O (where the two axes come together), we would have an unemployment rate of ______ percent.
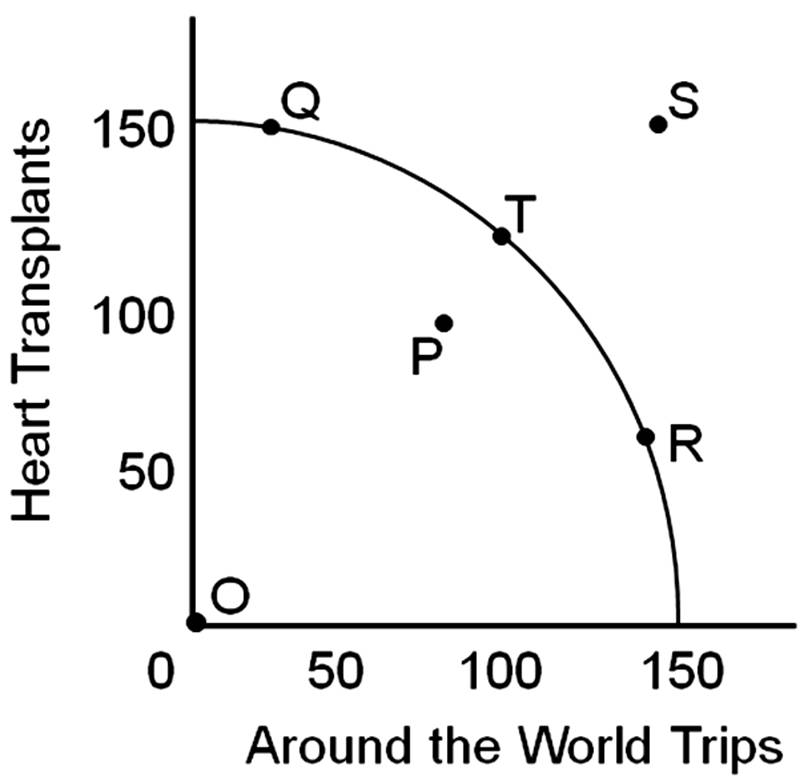
A. 5
B. 50
C. 95
D. 100