Refer to the below graph. The relationship between the average tax rate and the tax base in a proportional tax would be represented by:
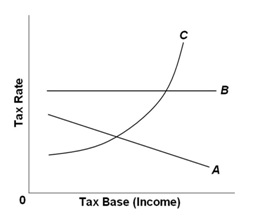
A. Curve A
B. Curve B
C. Curve C
D. None of the graphs
B. Curve B
You might also like to view...
Figure 4.4 illustrates the supply of tacos. If the government offered a subsidy to Mexican restaurants for each taco they produce, this would most likely cause a movement from
A) point a to point c. B) point c to point b. C) S0 to S1. D) S2 to S1.
If a bank needs to acquire funds quickly to meet an unexpected deposit outflow, the bank could
A) borrow from another bank in the federal funds market. B) buy U.S. Treasury bills. C) increase loans. D) buy corporate bonds.
If money wages increase, the most likely result is a(n)
A. increase in aggregate supply. B. decrease in aggregate supply. C. steeper aggregate supply curve. D. flatter aggregate supply curve.
The government is considering levying a tax on the pollution generated from two electric power plants (Plant A and Plant B). Plant A is located in a city with a high density of population, and Plant B is located in the rural area with a low density of population. The government should
A. tax only Plant A but not Plant B because Plant B generates less revenue. B. levy a higher tax per unit of pollution on Plant B because of its lower economic damage. C. levy the same tax per unit of pollution on both plants. D. levy a higher tax per unit of pollution on Plant A because of its higher economic damage.