Exhibit 3-3 Demand curves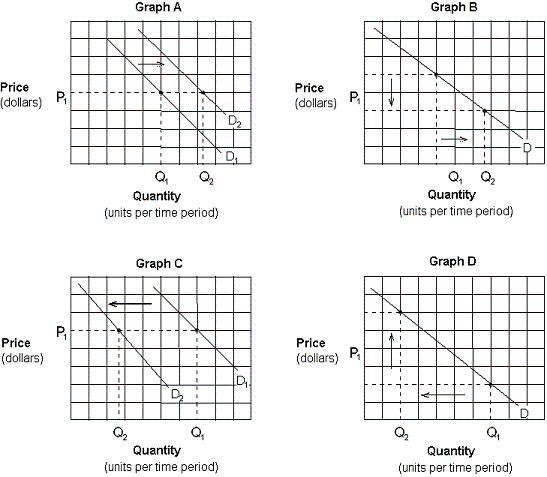
Which of the graphs in Exhibit 3-3 depicts the effect of a decrease in the price of pizza on the demand curve for pizza?
A. Graph A.
B. Graph B
C. Graph C.
D. Graph D.
Answer: B
You might also like to view...
The Golden Rule of capital accumulation maximizes the steady-state level of
A) output per worker. B) capital per worker. C) consumption per worker. D) investment per worker.
The poverty rate in the United States has __________ over the last 30 years.
A. remained the same B. increased C. decreased D. not been accurately measured
Using a commitment strategy in:
A. a simultaneous game can alter payoffs, but has no effect in sequential games. B. a simultaneous game has no effect, but can alter the payoffs and outcome of sequential games. C. either a simultaneous or sequential game has little impact on payoffs or outcome. D. either a simultaneous or sequential game can greatly alter the payoffs and outcome of the game.
Natalie can produce 6 shirts in a day, or cook three meals. Her opportunity cost of producing a shirt is 2 meals
Indicate whether the statement is true or false