The data in the above table indicate that when the price level is 100
A) inventories fall and the price level rises.
B) the economy is in a long-run macroeconomic equilibrium.
C) inventories rise and the price level falls.
D) the unemployment rate is at its equilibrium level.
A
You might also like to view...
Refer to the figure below.________ inflation will eventually move the economy pictured in the diagram from short-run equilibrium at point ________ to long-run equilibrium at point ________, 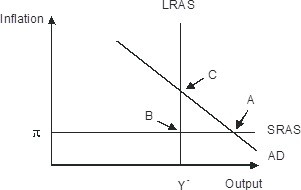
A. Rising; B; C B. Falling; A; C C. Falling; A; B D. Rising; A; C
________ will lead to an increase in the gross domestic product of a country, all other variables remaining unchanged
A) An increase in expenditure incurred by the government B) A fall in the expenditure on consumption C) An increase in imports D) A fall in the expenditure on investment goods
Answer the question on the basis of the following information: Only three goods are produced in an economy in the following amounts: A = 10, B = 30, C = 5. The current year per unit prices of these three goods are A = $2, B = $3, and C = $1. Refer to the above information. If the per unit prices of the three goods each were $1 in a base year used to construct a GDP price index, then real GDP in the current year is:
a) $110. b) $115. c) $45. d) $160.
Gross private domestic investment does not include:
A. spending for new houses. B. spending to build up inventories. C. unintentional inventory investment. D. spending on employee salaries.