Which of the following illustrates the data lag?
A) The economy turns down on January 8, 2006, but policymakers do not figure this out until April 19, 2006.
B) Policymakers wait and see what is really going on with the economy.
C) Policymakers implement policy X on September 12, 2006, but the effects are not felt until six months later.
D) The data lag is illustrated equally well by a, b, and c.
A
You might also like to view...
If a monopolist is producing at a point at which marginal revenue is greater than marginal cost, it should decrease the level of production
a. True b. False Indicate whether the statement is true or false
Olivia must decide whether or not to go to college. She can either continue to work as a waitress and earn $22,000 per year or she can go to school and expect to earn $32,000 per year when she finishes. She should
a. continue to work as a waitress. b. go to school, but only if she knows she can finish in four years. c. go to school no matter what. d. we cannot tell since there may be important nonmonetary considerations that Olivia will take into account.
Mutually beneficial trade will occur whenever the exchange rate between the goods involved is set at a level where:
A. each country can export a good at a price below the opportunity cost of producing the good in the domestic market. B. each country can import a good at a price below the opportunity cost of producing the good in the domestic market. C. the exchange ratio is exactly equal to the opportunity cost of producing the good in each country. D. each country will specialize in the production of those goods in which it has an absolute advantage.
Refer to the information provided in Figure 8.8 below to answer the question(s) that follow. 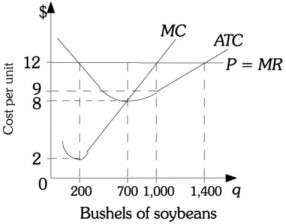 Figure 8.8 Refer to Figure 8.8. If the market price of soybeans falls to $8, then to maximize profits this farmer should produce
A. 200 bushels of soybeans. B. 700 bushels of soybeans. C. 1,000 bushels of soybeans. D. a level of output that is indeterminate from this information.