Present data in the form of tables. For the data set shown by the table, a. Create a scatter plot for the data. b. Use the scatter plot to determine whether an exponential function or a logarithmic function is the best choice for modeling the data.Number of Homes Built in a Town by Year 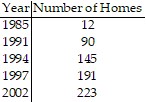
What will be an ideal response?
a.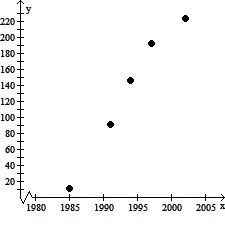
b. Exponential function
Mathematics
You might also like to view...
Provide an appropriate response.Perform the indicated operations: 3 - (-5)(2) + 4 -  2 -
2 -  (3) + 14
Fill in the blank(s) with the appropriate word(s).
Mathematics
Use ZERO (or ROOT) to approximate the smaller of the two x-intercepts of the equation. Express the answer rounded to two decimal places.y = x2 + 5x + 1
A. -4.79 B. 0.21 C. 4.79 D. -0.21
Mathematics
Change the logarithmic expression to an equivalent expression involving an exponent.logb 49 = 
A. b3/2 = 49
B. b2/3= 49
C. 492/3 = b
D.  b = 49
Mathematics
Answer the question.Which number is not divisible by 6?
A. 114 B. 282 C. 576 D. 278
Mathematics