Use the following graph for a competitive market to answer the question below.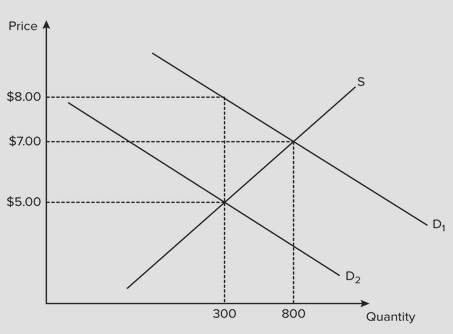 Assume the government imposes a $3 tax on buyers, which results in a shift of the demand curve from D1 to D2. The amount of the tax revenue paid by the seller is
A. $600.
B. $300.
C. $2100.
D. $900.
Answer: A
You might also like to view...
Mark is an 86-year-old watchmaker who works ten hours a week to supplement his retirement income. In determining the U.S. unemployment rate, Mark would be considered
a. employed b. unemployed c. an involuntary part-time worker d. not in the labor force e. a discouraged worker
In the early 1800s, there was a smallpox outbreak in a remote part of Russia. The government sent in a large group of army doctors, but they were too late to stop the epidemic. Thirty years later, there was another smallpox scare. A local statistician
cautioned the government against a similar response, noting the increased mortality and high number of army doctors during the earlier epidemic. Was the statistician providing good advice?
Government often finds it difficult to cope with externalities because
a. costs and benefits are difficult to assess in monetary terms. b. taxes and subsidies are ineffective in equating MSC and MSB. c. government has no authority to impose fines for air and water pollution. d. marginal private cost curves cannot be shifted.
The consumer price index is a measure of
A) the lowest prices paid by urban consumers for a fixed basket of consumer goods and services. B) the commodity prices paid by urban consumers for a fixed basket of consumer goods and services. C) the average of the prices paid by urban consumers for a fixed basket of consumer goods and services. D) the consumer prices paid by average households for a fixed basket of goods and services. E) the average of the prices paid by rural consumers for a fixed basket of consumer goods and services.