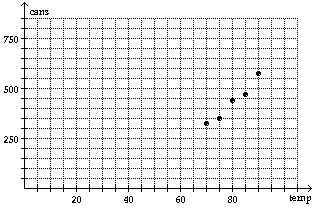
Solve.The following table shows the number of cans of soda sold at a campus stand on five different days, according to the high temperature on the day sold. Plot points that represent this data on a rectangular coordinate system.
What will be an ideal response?
Mathematics
You might also like to view...
Match the equation with the surface it defines.  +
+  = 1
= 1 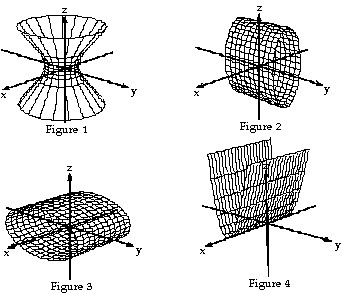
A. Figure 4 B. Figure 3 C. Figure 2 D. Figure 1
Mathematics
Graph the function f by starting with the graph of y = x2 and using transformations (shifting, compressing, stretching, and/or reflection).f(x) = -x2 - 4x 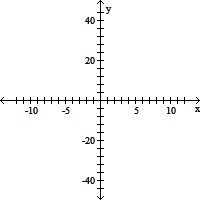
A. 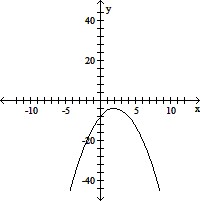
B. 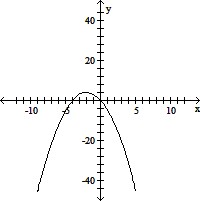
C. 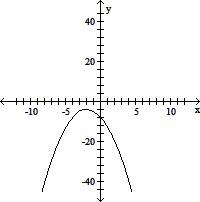
D. 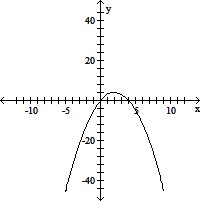
Mathematics
Solve by using the quadratic formula.5x2 + 12x + 2 = 0
A. 
B. 
C. 
D. 
Mathematics
Graph the function.y = 9 - 8
- 8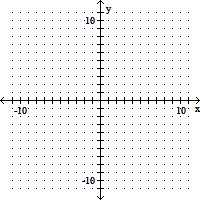
A. 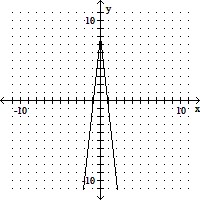
B. 
C. 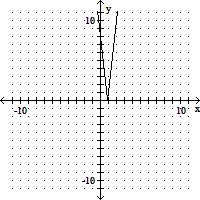
D. 
Mathematics