Of the collection of supply and demand diagrams in Figure 2.2, which one shows the result of an increase in the price of a complement for a good?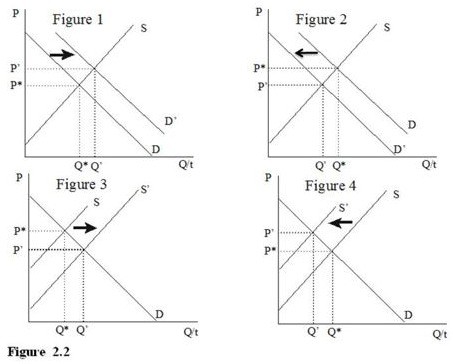
A. Figure 1
B. Figure 2
C. Figure 3
D. Figure 4
Answer: B
You might also like to view...
The above figure shows the demand and cost curves facing a monopoly. The deadweight loss of this monopoly is
A) $100. B) $250. C) $1,250. D) $2,500.
Assume a firm is run as a zero-profit enterprise. Which of the following would be true?
A) There is a higher probability that wage reductions would outweigh layoffs. B) Those in charge would not act any different than regular owners, there would still be layoffs. C) Those not in charge would remain risk neutral. D) Wage reductions would be lower than they would be if the firm was run for profit.
How do the wages in the United States compare to those in northern Europe?
a. U.S. wage rates are higher than those of all northern European nations. b. Northern Europe's average wage rates are higher. c. U.S. wage rates are higher than those in Germany and the Netherlands. d. they are similar.
To aggregate 300 tons of steel, 5,000 bushels of wheat, and 1 million barrels of crude oil, economists add together the ________ of the three products
A. units B. weight C. number of tons, bushels, and barrels D. dollar value