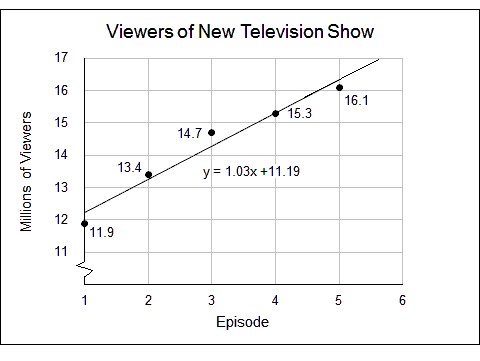
Solve.The scatter plot shows the total number of viewers, in millions, for the first five episodes of a new television show. The linear regression for the data points is graphed as well. Use the regression line to predict the number of viewers for episode 11.
A. 21.49 million
B. 23.55 million
C. 11.33 million
D. 22.52 million
Answer: D
Mathematics
You might also like to view...
Find the inverse of the function.f(x) =  - 9, x ? 0
A. f-1(x) = x + 9, x ? 9 B. f-1(x) = (x + 9)2, x ? 9 C. f-1(x) = (x - 9)2 D. f-1(x) = -(x + 9)2, x ? 9
Mathematics
Use the given transformation to evaluate the integral. src="https://sciemce.com/media/4/ppg__10612191744__f1q59g7.jpg" alt="" style="vertical-align: -4.0px;" /> 


 Rwhere R is the parallelepiped bounded by the planes


A. 5
B. 
C. 30
D. 
Mathematics
Evaluate the limit by direct evaluation. Change the form of the function where necessary.

A. -7 B. Does not exist C. 49 D. 7
Mathematics
Find the differential of the function.y = 9 -
- 
A.  dx
dx
B.  dx
dx
C.  dx
dx
D.  dx
dx
Mathematics