Refer to the supply and demand graph below. S1 and D1 represent the current market supply and demand, respectively. S2 and D2 represent the socially optimal supply and demand. The positions of the graphs indicate that there is (are):
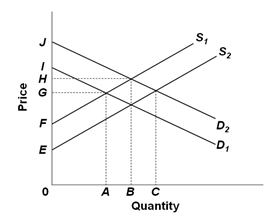
A. External benefits from production and external costs from consumption of the product
B. External costs from production and external benefits from consumption of the product
C. External benefits from production and consumption of the product
D. External costs from production and consumption of the product
C. External benefits from production and consumption of the product
You might also like to view...
The dollar value of final output
A) is equal to total income. B) is less than total income. C) equals profits. D) is greater than total income.
Refer to the scenario above. If the government removes the ban on Firm B and both Firm A and firm B aim at maximizing profits:
A) marginal cost of Firm A will eventually be greater than the marginal cost of Firm B. B) marginal cost of Firm B will eventually be greater than the marginal cost of Firm A. C) marginal cost of both firms will eventually be equalized. D) the difference in the marginal cost of both firms will eventually increase.
Explain how the demand for labor is determined
If the current account is in deficit, we know that
A. there is a statistical discrepancy in the surplus. B. the merchandise trade balance is also in deficit. C. the merchandise trade balance is in surplus. D. the financial account is in surplus.