 Refer to Figure 5.2, which shows a family of average cost curves. The average total cost curve is represented by:
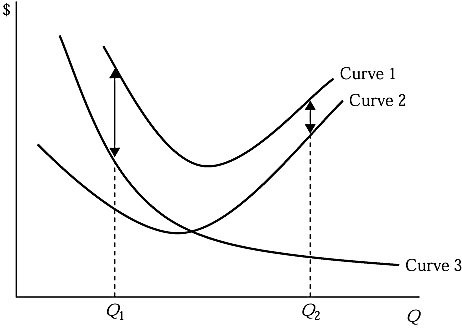
A. Curve 1.
B. Curve 2.
C. Curve 3.
D. the vertical sum of curve 1 and curve 2.
Answer: A
You might also like to view...
Which of the following is a valid reason for protecting an industry?
A) The industry is unable to compete with low-wage foreign competitors. B) Protection penalizes lax environmental standards. C) Protection keeps richer nations from exploiting the workers of poorer countries. D) None of the above reasons is a valid reason for protection.
The price of a barrel of oil doubled between 2007 and the middle of 2008. To make matters worse, a financial crisis hit the U.S. economy starting in August of 2007. Which of the following is TRUE of the United Kingdom's experience?
A) The increase in the price of oil immediately shifted the AS curve to the left. B) The financial crisis did not take hold right away so the AD curve did not immediately shift. C) Eventually, the Lehman Brothers bankruptcy caused a negative demand shock leading to a further fall in output and an increase in the unemployment rate. D) All of the above. E) None of the above.
The marginal cost is the:
a. b and c. b. change in total cost as the quantity changes by one unit. c. change in total variable cost as the quantity changes by one unit. d. change in total fixed cost as the quantity changes by one unit. e. same as the fixed cost when average fixed cost is at a minimum.
Arabia Telecom is a major producer of telecommunications equipment in Dubai. The Free Market French Conglomerate is a collection of the top 5 telecommunication firms in France that wish to upgrade their communications infrastructure. When the conglomerate buys 5 million United Arab Emirates Dirhams worth of equipment from Arabia Telecom, the: a. demand curve for United Arab Emirates Dirhams and
the supply curve for euros both shift rightward. b. demand curve for United Arab Emirates Dirhams shifts leftward and the supply curve for euros shifts rightward. c. supply curve for United Arab Emirates Dirhams shifts leftward and the demand curve for euros shifts rightward. d. supply curve for United Arab Emirates Dirhams and the demand curve for euros both shift rightward.