Use the indifference curves and the budget lines in Figure 19.3 to answer the indicated question. Assume the price of Y is $1 per unit. If the price per unit of good X is $3, the consumer would maximize utility at point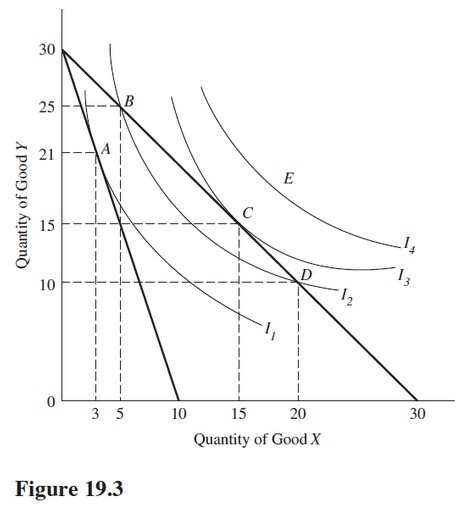
A. A.
B. B.
C. C.
D. D.
Answer: A
You might also like to view...
The long-run aggregate supply curve illustrates the
A) relationship of the price level and real GDP when the economy is at full employment. B) relationship of the price level and real GDP when the economy is at zero unemployment. C) amount of products producers offer at various prices when money wages and other resource prices are fixed. D) surpluses, shortages and equilibrium level of GDP.
In the above figure, suppose the economy is initially on the demand for money curve MD1. What is the effect of an increase in the use of credit cards?
A) The demand for money curve would shift rightward to MD2. B) The demand for money curve would shift leftward to MD0. C) There would be a movement upward along the demand for money curve MD1. D) There would be a movement downward along the demand for money curve MD1.
The value of marginal product (VMP) of labor is the extra revenue generated by
A) selling one additional unit of output. B) raising the price of the good by one dollar. C) hiring one additional unit of labor. D) price discrimination.
Suppose the population of a fictional economy falls into the following categories: 320 are employed full time; 110 are employed part time; 20 are unemployed but are actively looking for employment; 50 are unemployed and are not actively looking for
employment. The official unemployment rate as calculated by the BLS would be A) 4.4%. B) 5.9%. C) 14.0%. D) 28.9%.