By looking at the graph showing the poverty rate from 1959 to 2016, you can see that poverty increased ______.
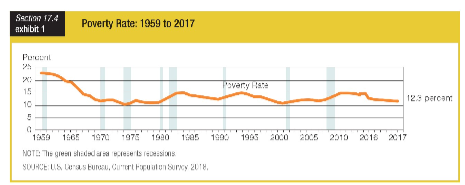
a. in the 1960s
b. in the 1970s
c. in early 1990s
d. between 2012 and 2016
c. in early 1990s
You might also like to view...
When Javier's income increases by $5,000, he spends an additional $3,750 dollars. This implies that his marginal propensity to consume is 0.75
Indicate whether the statement is true or false
Which of the following is one of the chief reasons for the increased number of married women in the U.S. work force?
a. The marginal cost of working in the labor force has increased. b. Jobs provide greater independence and self-worth. c. The opportunity cost of household work has increased. d. The sunk cost of household appliances has risen to the point that women must work to make payments on them. e. Women spend more time in the market as a result of the increasing division of labor in household production.
A natural monopoly arises in an industry in which the per-unit cost of production is: a. lowest when there are a large number of producers in the industry. b. lower for the smaller firms than for larger firms
c. minimized at the output where the industry's profit is maximum. d. lowest when a single firm produces the entire output of the industry.
Disembodied technical change results in
A. an increase in the labor supply. B. a change in the production process. C. embodied technical change. D. population growth.