What marginal propensity to save is represented in this graph?
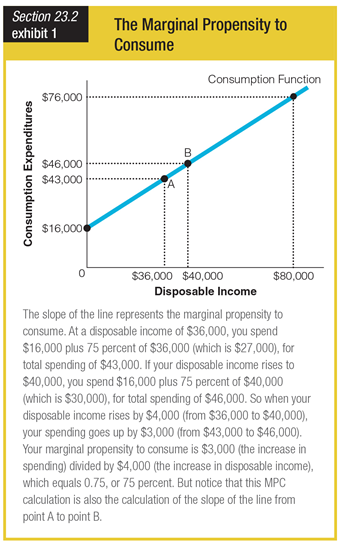
a. 0.25
b. 0.5
c. 0.75
d. 1.0
a. 0.25
You might also like to view...
If the government were to increase taxes, it would be enacting:
A. contractionary fiscal policy. B. expansionary fiscal policy. C. contractionary monetary policy D. expansionary budgetary policy.
The long-run average total cost curve
a. is an envelope-shaped curve mapped out by the short-run average total cost curves for alternative plant sizes. b. intersects the minimum point of each short-run average total cost curve for alternative plant sizes. c. rises throughout its entire range when increasing returns are present. d. falls throughout its entire range due to the law of diminishing returns.
If the minimum wage law sets a price floor above the equilibrium wage in the market for unskilled labor, then the
A) minimum wage will create a surplus of unskilled labor. B) minimum wage will create a shortage of unskilled labor. C) minimum wage will not impact the unskilled labor market. D) unskilled labor market will change, but we cannot be certain how.
Exhibit 2-18 Production possibilities curves In Exhibit 2-18, the production possibilities curves for a country are shown for the years Year X and Year Y. Suppose this country was located at point A in Year X and point B in Year Y. This country:
A. is producing the same number of capital goods in both years. B. is producing the same number of consumption goods in both years. C. has shown no growth between Year X and Year Y. D. has higher unemployment in Year X than in Year Y.