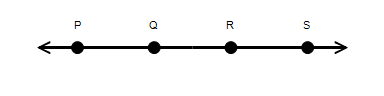
Use the illustration in the figure below to draw the figure  .
.
?
?
A. 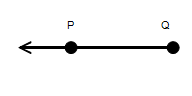
B. 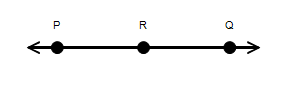
C. 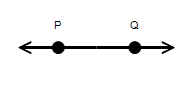
D. 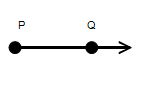
E. 
Answer: C
You might also like to view...
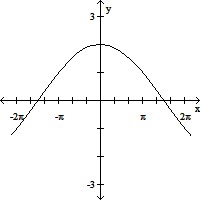
Match the given function to its graph.1) y = 2 sin (3x)2) y = 2 sin ( src="https://sciemce.com/media/4/ppg__ttt0506190847__f1q103g6.jpg" alt="" style="vertical-align: 0.0px;" height="200" width="200" />
A. 1C, 2A, 3B, 4D
B. 1A, 2C, 3D, 4B
C. 1D, 2B, 3A, 4C
D. 1C, 2A, 3D, 4B
 x)3) y = 2 cos (3x)4) y = 2 cos (
 x)AB
x)AB ?
? CD
CD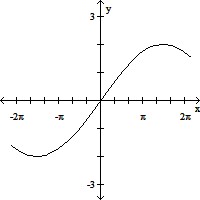 ?
?
Simplify the expression and eliminate any negative exponent(s).  figure 1.png)
What will be an ideal response?
Factor completely.200x6y - 320x3y3 + 128y5
A. 8y(5x3 - 4y2)2 B. 8y(5x3 + 4y2)(5x3 - 4y2) C. y(40x3 - 32y2)(5x3 - 4y2) D. 8(5x3y - 4y2)2
Solve the problem.Ultraviolet radiation from the sun is thought to be one factor causing skin cancer. The amount of UV radiation a person receives is a function of the thickness of the earth's ozone layer which depends on the latitude of the area where the person lives. The following data represent the latitudes and melanoma rates for nine randomly selected areas in the United States. The melanoma rates refer to a three-year period. 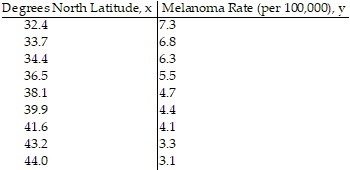 Graph the data on a scatterplot treating latitude as the independent variable. Find an equation of the line containing the points
/> and  Express the relationship using the function name f. Graph the line on the scatterplot. Interpret the slope of the line. Use the line to predict the melanoma rate of an area with a latitude of 39.1 degrees north.
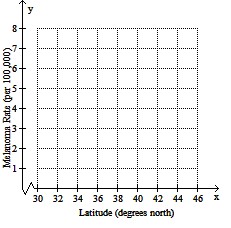
What will be an ideal response?