Equilibrium GDP can be depicted graphically as that point where the _________ and _________ cross.
Fill in the blank(s) with the appropriate word(s).
aggregate demand curve; aggregate supply curve
You might also like to view...
With respect to the health insurance market, what is moral hazard?
A) Moral hazard refers to the actions people take, after they purchase an insurance policy, that make the insurance company worse off. B) Moral Hazard refers to to people who purchase one type of insurance policy when they would have been better off purchasing a different policy. C) Moral Hazard refers to the situation in which a person purchasing an insurance policy takes advantage of knowing more about his health than the insurance company. D) Moral hazard refers to the actions people take before they purchase an insurance policy.
Which of the following is most likely to lead to an increase in the value of the dollar?
A) decline in U.S. interest rates B) increase in imports to the United States C) decrease in exports from the United States D) increase in U.S. interest rates compared to foreign interest rates
Refer to the above figure. Which of the following would allow society to move to point d?
A) producing efficiently B) concentrating production in wheat C) increasing the quantity of labor D) using the best land to produce wheat and the lower quality land to produce beans
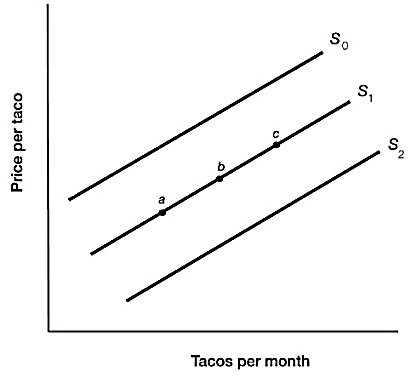
 Figure 3.5 illustrates the supply of tacos. A technological advancement which makes tacos cheaper to produce would most likely cause a movement from:
A. point a to point c. B. point c to point a. C. S2 to S0. D. S0 to S2.