Give an appropriate answer.The following table shows the average life expectancy in a certain country in the given years. 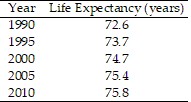 Draw a bar graph that makes the increase in the life expectancy look large.
What will be an ideal response?
Answers may vary. One possible solution: 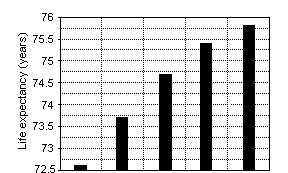
| 1990 | 1995 | 2000 | 2005 | 2010 |
| Year |
You might also like to view...
Analyze the situation and explain how you would make a decision.You are leasing a summer home for twelve weeks and are required to cut the grass every week. You can buy a new power mower for $340 and sell it at the end of the summer for $100. You can rent a power mower for $20 per day. The neighbor's son will charge you $10 per hour for 2 hours and provide his own equipment. Which is the best option?
What will be an ideal response?
Find the median for the set of numbers.Number of video tapes borrowed each day: 73, 92, 269, 273, 349, 474
A. 269 video tapes B. 218 video tapes C. 273 video tapes D. 271 video tapes
Provide an appropriate response. Which type of statistical graph best shows how an item or items change over time?
A. circle B. line C. bar D. table
Solve the problem.In a certain apportionment problem, State X has a standard quota of 48.9. The final apportionment to State X is 50 seats. This is called
A. a lower-quota violation. B. the population paradox. C. an upper-quota violation. D. the Alabama paradox. E. none of these