The graph below indicates the number of new cases of Chalk Dust Disease (CDD) diagnosed each month in the Mathland. Let T(t) represent the total number of new cases per month, F(t) the number of new cases per month among algebraists, G(t) the number of new cases per month among geometers, and t the number of years since January 1, 1990.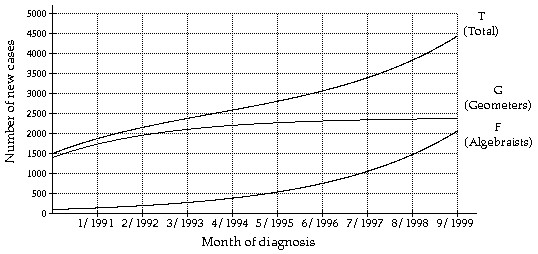 Estimate G(5) and interpret its meaning.
A. 540; In January, 1995, there were about 540 new cases of CDD diagnosed among algebraists.
B. 2300; In January, 1995, there were about 2300 new cases of CDD diagnosed among geometers.
C. 2800; In January, 1995, there were about 2800 new cases of CDD diagnosed.
D. 2800; In January, 1995, there were about 2800 new cases of CDD diagnosed among geometers.
Answer: B
Mathematics
You might also like to view...
Find ? for 0° ? ? < 360°.csc ? = 1.441
A. 43.94°, 136.06° B. 43.94°, 316.06° C. 55.24°, 235.24° D. 46.06°, 313.94°
Mathematics
Solve. = 9
= 9
A. 80 B. 40 C. 20 D. -40
Mathematics
Simplify the rational expression. If the expression is already in simplest form, state this as your answer.
A. - 
B. - 
C. - 
D. simplest form
Mathematics
Simplify. Assume that all variables represent positive numbers.
A. 
B. 1
C. 
D. 
Mathematics