The line graph shows the recorded hourly temperatures in degrees Fahrenheit at an airport. 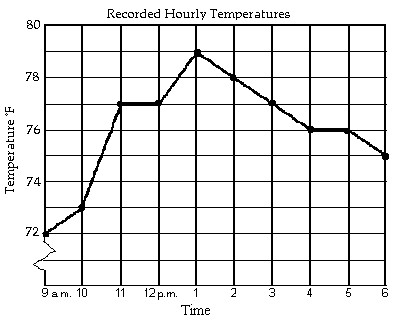 During which two hour period did the temperature increase the most?
A. 9 a.m. to 11 a.m.
B. 12 p.m. to 2 p.m.
C. 10 a.m. to 12 p.m.
D. 10 a.m. to 11 a.m.
Answer: A
Mathematics
You might also like to view...
Use transformations of the graphs of y = x2 or y = |x| to sketch a graph of f by hand.f(x) = 5x2 + 5 
A. 
B. 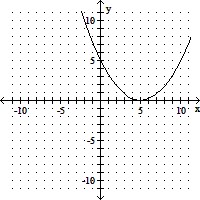
C. 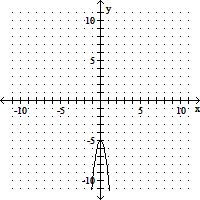
D. 
Mathematics
Divide.-  ÷
÷ 
A. - 
B. - 
C. 
D. 
Mathematics
Use common logarithms or natural logarithms and a calculator to evaluate to four decimal placeslog100 30
A. 3.4012 B. 4.6052 C. 1.354 D. 0.7386
Mathematics
Simplify the rational expression.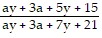
A. 
B. 
C. 
D. 
Mathematics