Refer to the graph shown. Total surplus is maximized when: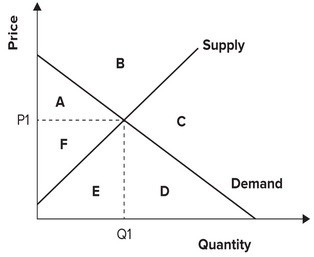
A. producers are able to charge a price above P1.
B. excess demand is maximized.
C. consumers are able to pay a price below P1.
D. the market is in equilibrium at price P1 and quantity Q1.
Answer: D
You might also like to view...
In the table above, Jill's opportunity cost for 1 pound of food is ________ and her opportunity cost for 1 pound of clothing is ________
A) 1 pound of clothing; 4 pounds of food B) 1/2 of a pound of clothing; 2 pounds of food C) 1/3 of a pound of clothing; 3 pounds of food D) 2 pounds of clothing; 2 pounds of food E) 1 pound of food; 1 pound of clothing
A price ceiling of $8 placed on the market in the graph shown:
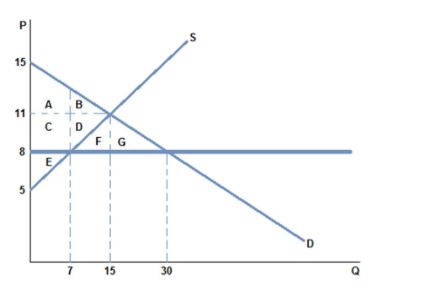
A. is non-binding, and does not affect the market.
B. is binding, and causes a shortage.
C. is binding, and causes a surplus.
D. is non-binding, and does not prevent the market from reaching equilibrium.
Which of the following best describes the goal of economic efficiency?
(A) Making the most of resources. (B) Achieving full employment. (C) Assurance that goods and services will be available. (D) Fair distribution of wealth.
When companies add to their inventories
A. the amount of the change has no effect on the GDP. B. net exports go up. C. the amount of the change gets subtracted from the GDP. D. the amount of the change gets added to the GDP.