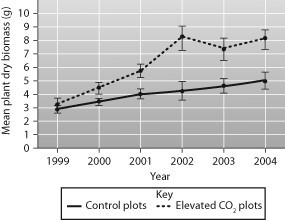
Which of these can be concluded from the figure below?
A) In some years of the study the mean poison ivy biomass decreased to the level it was at the beginning of the study.
B) There were more elevated CO2 plots than control plots.
C) Not all of the increase in mean poison ivy biomass can be attributed to the CO2 that the researcher added.
D) Poison ivy in the experimental plots was more toxic than that in the control plots.
Answer: C
You might also like to view...
All of the following about Homo habilis is true except
A. the species lived in Africa for 500,000 years and then became extinct. B. the species coexisted with dinosaurs. C. the species was replaced by a new kind of human, which had a larger brain. D. the species was small in stature. E. the species was associated with tools.
The amount of air that enters and leaves the lungs with each breath is the ____
a. respiratory volume b. respiratory rate c. vital capacity d. tidal volume e. inspiratory volume
What is removed from dNTPs to provide the energy required for DNA polymerase to catalyze DNA strand elongation?
What will be an ideal response?
In animals that display indeterminate development
A. early embryonic cells, if separated from the embryo, can develop into complete organisms. B. bilateral symmetry cannot develop. C. embryonic cells have a predetermined fate. D. embryonic cells show spiral cleavage. E. the blastopore develops into the mouth.