Following are summary statistics for two data sets, A and B.
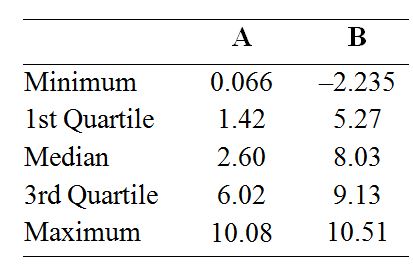
a. Compute the interquartile ranges for both A and B.
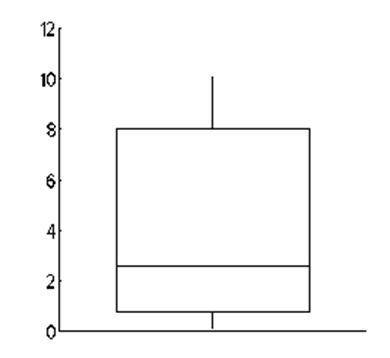
b. Do the summary statistics for A provide enough information to construct a boxplot? If so, construct the boxplot. If not, explain why.
c. Do the summary statistics for B provide enough information to construct a boxplot? If so, construct the boxplot. If not, explain why.
(a) IQR = 3rd quartile – 1st quartile. A: IQR = 6.02 – 1.42 = 4.60, B: IQR = 9.13 – 5.27 = 3.86
(b) Yes, since the minimum is within 1.5 IQR of the first quartile and the maximum is within 1.5 IQR of the third quartile, there are no outliers, and the given numbers specify the boundaries of the box and the ends of the whiskers.
(c) No. The minimum value of –2.235 is an “outlier,” since it is more than 1.5 times the interquartile range below the first quartile. The lower whisker should extend to the smallest point that is not an outlier, but the value of this point is not given.
You might also like to view...
The concepts applied in economic evaluation to address the time-dependent value of money can also be applied to other phenomena, such as growth in traffic volume. The traffic volume on a local highway was 3,510 vehicles per day on an average day in 2012. Based on historical trends, the traffic volume is expected to increase by 3% per year for the foreseeable future. What is the expected traffic volume in 2022?
What will be an ideal response?
Why were trees often seen as pests by the first Europeans to settle in America?
What will be an ideal response?
By the 1990s, which European country had the highest proportion of female government representation?
a. Sweden b. France c. Britain d. Germany
When the 8085 accesses data in an I/O device using IN or OUT instructions, it is using
A) memory mapped I/O. B) software controlled I/O. C) serial I/O. D) standard I/O.