Make a line graph of the data in the table.The following table shows the median teacher's salary in District X over several years. Use time on the horizontal scale for your line graph.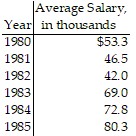
What will be an ideal response?
Answers may vary. The following is a possible answer.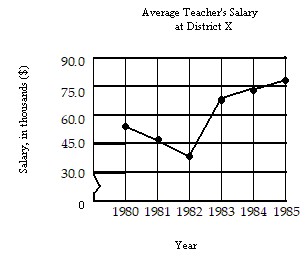
You might also like to view...
Use the Consumer Price Index below to answer the question.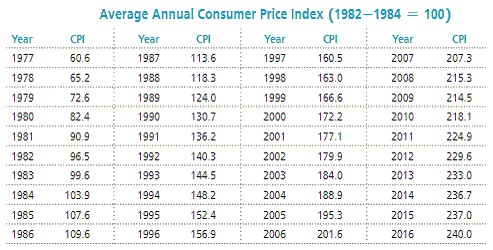 In 1995, the price of gasoline was 120.5 cents per gallon. In 2000 it was 155.0 cents per gallon. Find the relative change in the price of gasoline over that period and compare it to the overall rate of inflation as measured by the CPI. In real terms, was gasoline more expensive in 1995 or 2000? If necessary, round values to the nearest tenth.
What will be an ideal response?
Evaluate the integral by changing the order of integration in an appropriate way.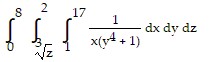
A. 
B. 
C. 
D. 
Find the quotient.894 ÷ 15
A. 57 R 7 B. 59 C. 58 R 6 D. 59 R 9
Find the missing values.
A. 2%, $72.00 B. 21%, $72.00 C. 22%, $72.00 D. 20%, $72.00