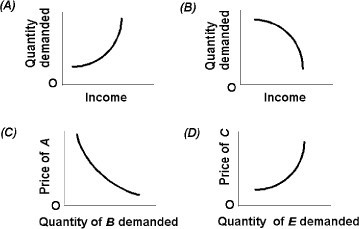
 Use the above figure. Which graph depicts complementary goods?
A. A
B. B
C. C
D. D
Answer: C
You might also like to view...
Which of the following statements is true of inequality in the U.S. economy?
A) Inequality in the U.S. economy is now less than what it was in the year 1950. B) Inequality in the U.S. economy is now higher than what it was in the year 1950. C) Inequality in the U.S. economy had increased throughout the 20th century. D) Inequality in the U.S. economy had decreased throughout the 20th century.
A fall in the level of prices
A) does not affect the value of money. B) has an uncertain effect on the value of money. C) increases the value of money. D) reduces the value of money.
The IMF often requires countries that borrow from it to introduce policies that privatize government-owned industries such as telecommunications and power generation. This is an example of:
A. limited capital account convertibility. B. infrastructure investment. C. a balance of payments constraint. D. conditionality.
The Congressional Budget Office estimates that ________ of the increase in federal spending on Medicare and Medicaid over the next 75 years will be due to increases in the cost of providing health care
A) very little B) less than half C) most D) all