Use a graphing calculator to plot the data and find the quadratic function of best fit.The following data represents the total revenue, R (in dollars), received from selling x bicycles at Tunney's Bicycle Shop. Using a graphing utility, find the quadratic function of best fit using coefficients rounded to the nearest hundredth. 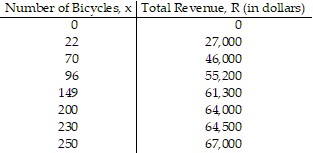
What will be an ideal response?
R(x) = -1.65x2 + 634.42x + 7089.93
You might also like to view...
Graph the function by plotting points.g(x) = -2x + 10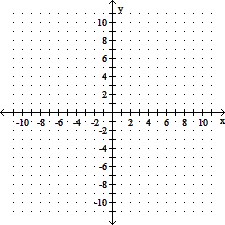
A. 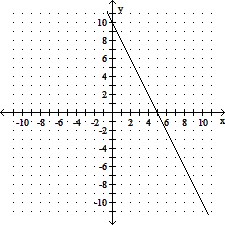
B. 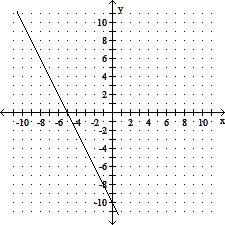
C. 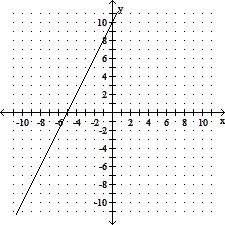
D. 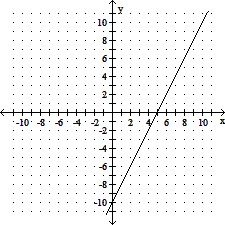
Approximate the area under the curve and above the x-axis using n rectangles. Let the height of each rectangle be given by the value of the function at the right side of the rectangle.y = x2 - 3x + 4 from x = 1 to x = 5; n = 4
A. 18 B. 28 C. 48 D. 38
Find the area of the figure.Each square is 8 ft by 8 ft.
A. 512 ft2 B. 320 ft2 C. 768 ft2 D. 384 ft2
Complete the horizontal analysis for the balance sheet. Round to the nearest tenth of a percent.
A. -40.1%, 33.1%, 14.3%, 33.0%, 15.5%, 46.9%, 19.2% B. -66.7%, 25.0%, 12.5%, 24.8%, 13.5%, 31.9%, 16.1% C. -40.0%, 33.3%, 14.3%, 33.0%, 15.5%, 46.9%, 19.3% D. 166.7%, 75.0%, 87.5%, 75.2%, 86.5%, 68.1%, 83.9%