Solve the problem.An accountant tabulated a firm's profits for four recent years in the following table: The accountant then fit both a linear graph and an exponential curve (seen below) to the data, in order to estimate future profits. Use the linear graph to estimate the profits in the year 2002.
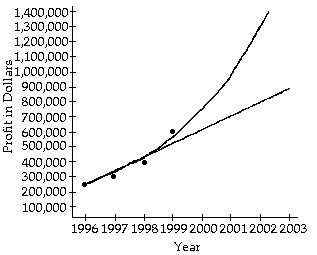
A. About $1,000,000
B. About $900,000
C. About $800,000
D. About $500,000
Answer: C
Mathematics
You might also like to view...
Find the derivative of y with respect to the independent variable.y = 7x
A. x ln 7 B. 7x C. 7x ln 7 D. 7x ln x
Mathematics
Provide an appropriate response.Describe the graph of the solution set of the following inequality:y > -x2 - 7
What will be an ideal response?
Mathematics
Identify the property illustrated by the statement. Assume all variables represent real numbers.8 + 0 = 8
A. Associative B. Identity C. Closure D. Inverse
Mathematics
Factor by grouping.15x2 - 9x - 10x + 6
A. (15x + 2)(x + 3) B. (15x - 2)(x - 3) C. (3x + 2)(5x + 3) D. (3x - 2)(5x - 3)
Mathematics