Solve the problem.The information in the chart below gives the salary of a person for the stated years. Model the data with a linear equation using the points (1, 24,400) and  Then use this equation to predict the salary for the year 2005.
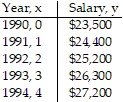
A. $37,730
B. $37,790
C. $37,770
D. $37,750
Answer: D
Mathematics
You might also like to view...
Use a graphing calculator to solve the system of equations. Round your solutions to one decimal place.2.8x + 1.3y - 4.1z = 2.54.1x - 6.7y + 1.9z = -4.74.6x + 4.8y + 5.6z = 8.1
A. (0.3, 0.5, 0.0) B. (2.2, 4.2, 0.4) C. (1.1, 2.1, 0.2) D. (0.5, 1.1, 0.1)
Mathematics
Write an equation of the line through the given point with the given slope. Write the equation in slope-intercept form.(-7, 10); m = 0
A. y = 10
B. y =  x + 0
x + 0
C. y =  x + 0
x + 0
D. x = -7
Mathematics
Graph the inequality.x + y < -4
A. 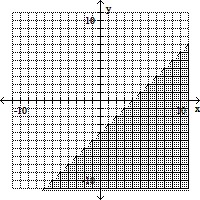
B. 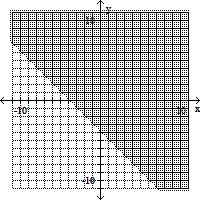
C. 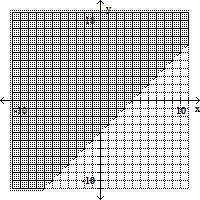
D. 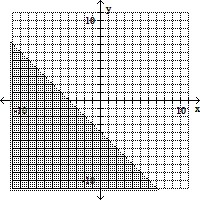
Mathematics
Use the center, vertices, and asymptotes to graph the hyperbola. -
-  = 1
= 1 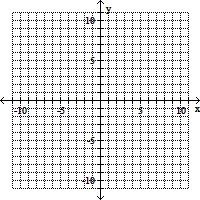
A. 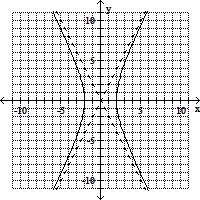
B. 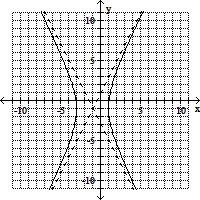
C. 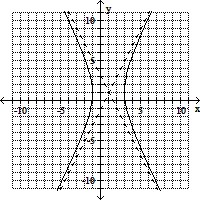
D. 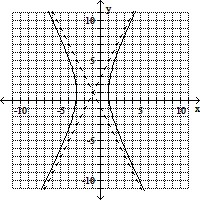
Mathematics