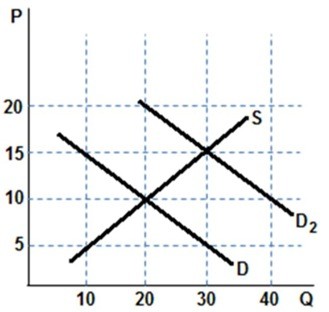
 Assume the graph shown represents the market for bottles of wine and was originally in equilibrium with D and S. Something changes and demand shifts to D2. Which of the following is true?
A. Equilibrium quantity increased by 20.
B. Equilibrium price increased by $5.
C. Equilibrium quantity increased by 30.
D. Equilibrium price increased by $15.
Answer: B
You might also like to view...
Suppose that marginal revenue for a perfectly competitive firm is $20 . When the firm produces 10 units, its marginal cost is $20, its average total cost is $22, and its average variable cost is $17
Then to maximize its profit in the short run, the firm A) should stay open and incur an economic loss of $20. B) must increase its output to increase its profit. C) must decrease its output to increase its profit. D) should shut down. E) should not change its production because it is already maximizing its profit and is making an economic profit.
Which of the following allows workers to focus on the types of production where they have an advantage?
a. Deindustrialization b. Diseconomies of scale c. Scarcity d. Specialization
One problem with using monetary policy to address "bubbles" in asset markets is that:
A. the Federal Reserve is better than financial-market professionals at identifying bubbles. B. the Federal Reserve is not interested in stabilizing output. C. reducing the real interest rate to deal with the bubble could lead to inflation. D. monetary policy is not a very good tool for addressing the problem of inappropriately high asset prices.
Consumers often base their spending on their estimated permanent income.
Answer the following statement true (T) or false (F)