Which of the following statements is the best description of the total MSW generation between 1960 and 2010?
A. Between 1960 and 2000, total MSW generation increased. After 2000, total MSW generation declined.
B. Between 1960 and 2010, total MSW generation remained constant.
C. Between 1960 and 2005, total MSW generation increased at a steady rate. After 2005, total generation leveled off.
D. Between 1960 and 2010, total MSW generation increased steadily.
Ans: C. Between 1960 and 2005, total MSW generation increased at a steady rate. After 2005, total generation leveled off.
You might also like to view...
The following questions are based on Figure 27-3, the photograph of a soil profile.
You may view this image in color by going to the Lab Manual website at MasteringGeography, or by scanning the QR code for this exercise. The depth scale is in inches.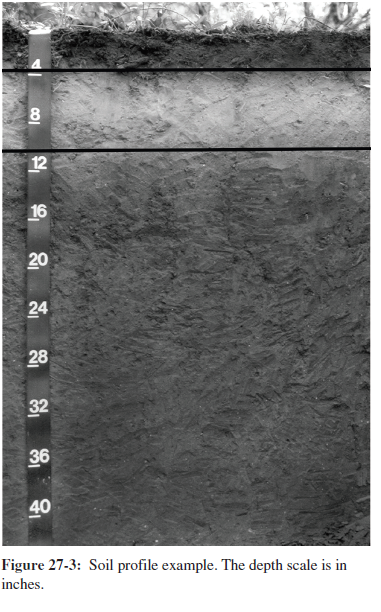
What will be an ideal response?
Divisions of the geologic time scale are divided into equal increments of 250 million years
a. True b. False
The dangers of widespread DDT use are largely due to two main characteristics of DDT, its
A) bioremediation and nonpersistence. B) degradation and nonpersistence. C) biomagnification and persistence. D) bioremediation and persistence.
Atmospheric stagnation is a condition normally brought on by ____
a. gusty winds behind a cold front b. light winds and poor vertical mixing c. overcast skies d. tall buildings in a city e. movement of an upper level trough overhead