Refer to the information provided in Figure 2.1 below for the economy of Macroland to answer the question(s) that follow.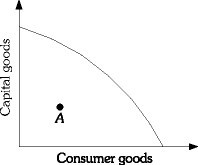 Figure 2.1Refer to Figure 2.1. The shape of Macroland's production possibility frontier shows
A. random opportunity costs.
B. increasing opportunity costs.
C. constant opportunity costs.
D. decreasing opportunity costs.
Answer: B
You might also like to view...
Which of the following varies directly with the interest rate?
A. the opportunity cost of holding money B. the asset demand for money C. the level of investment D. the transactions demand for money
Refer to Figure 10.7. A movement from point B to point D could be caused by
A) an increase in the target interest rate. B) an increase in consumer confidence. C) an increase in the term structure effect. D) a decrease in the expected rate of inflation.
To decide whether the slope coefficient indicates a "large" effect of X on Y, you look at the
A) size of the slope coefficient B) regression R2 C) economic importance implied by the slope coefficient D) value of the intercept
Which of the following statements is not correct?
a. Tradable pollution permits have an advantage over corrective taxes if the government is uncertain as to the optimal size of the tax necessary to reduce pollution to a specific level. b. Both corrective taxes and tradable pollution permits provide market-based incentives for firms to reduce pollution. c. Corrective taxes set the maximum quantity of pollution, whereas tradable pollution permits fix the price of pollution. d. Both corrective taxes and tradable pollution permits reduce the cost of environmental protection and thus should increase the public's demand for a clean environment.