How can you use numbers to present test results?
What will be an ideal response?
Test results most often take the form of numbers, such as the number of minutes a child plays with a toy, the amount of force a component or product can withstand without crushing or other failure, or the percentage of people rating the product "very good" and "excellent." Presenting this information in a narrative or description can sometimes be tedious. Graphic presentation through charts, graphs, diagrams, and tables is an effective technique. Be certain that figures are well labeled and clear for the reader.
You might also like to view...
To the left of the Txy plot are five overall compositions, pressures, and temperatures for a mixture of R-245fa (1) + isopentane (2). For each combination, list the equilibrium phases, what they are (LLE, VLE, etc) and what are the compositions (in terms of mole fractions) of each of the equilibrium phases.
Z1 = 0.2; P = 1.0 bar; T = 290K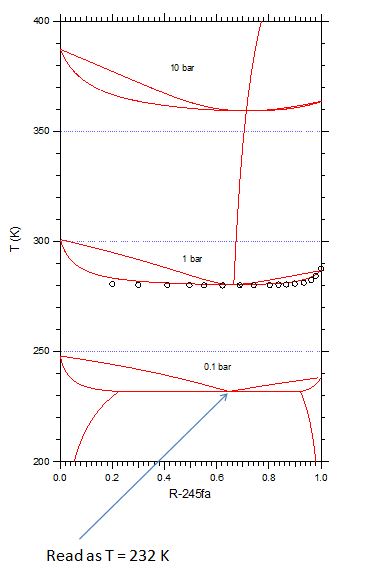
Providing chew bones and tartar-controlling treats is the most effective method of preventing periodontal disease in dogs and cats
A. True B. False
Logix counter instruction ________
A) Has a PRE that holds the count value used to trigger an output on the counter output ON bit B) Has an ACC that counts true to false counter rung transitions C) Generates a true output bit when the value in the ACC is greater than the value in the PRE D) None of the above
The alternator is turned by a direct current motor or an AC motor coupled to a(n) ____________________ current clutch.
Fill in the blank(s) with the appropriate word(s).