Use a graphing calculator to plot the data and find the quadratic function of best fit.The following table shows the median number of hours of leisure time that Americans had each week in various years. Use x = 0 to represent the year 1988. Using a graphing utility, determine the quadratic regression equation for the data given. Round values to the nearest hundredth. What year corresponds to the time when Americans had the least time to spend on leisure?
What will be an ideal response?
M(x) = 0.04x2 - 1.21x + 26.03; 2003
Mathematics
You might also like to view...
Find the value of x and the value of y for which (x, 2) and (8, y) are points on the graph.2x + 3y = 5
A. x = -  , y = -
B. x = -  , y = -
C. x = -  , y = -
D. x = -  , y = - 7
Mathematics
Express the number as an equivalent decimal. Use bar notation for repeating decimals.
A. 4.72 B. 4.736 C. 4.745 D. 4.724
Mathematics
Write the form of the partial fraction decomposition of the rational expression. Do not solve for the constants.
?
 ?
?
A. 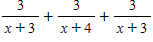
B. 
C. 
D. 
E. 
Mathematics
Find the center of mass of the particles with the given masses located at the given points.110 at (33.4, 0), 249 at (15.0, 0), 350 at (-11.6, 0), 422 at (-23.5, 0)
A.  = 85.0,
  = 0
= 0
B.  = -494,
  = 0
= 0
C.  = 1.01,
  = 0
= 0
D.  = -5.81,
  = 0
= 0
Mathematics