Exhibit 10-2 Aggregate supply and demand curves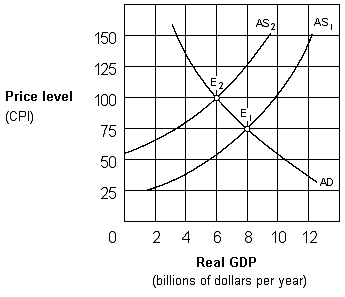
In Exhibit 10-2, the change in equilibrium from E1 to E2 represents:
A. cost-push inflation.
B. demand-pull inflation.
C. price-push inflation.
D. wage-push inflation.
Answer: A
You might also like to view...
The consumption curve will shift upward if real asset and money holdings
a. increase, if people expect prices to increase, if interest rates decrease, and if taxes decrease b. increase, if people expect prices to increase, if interest rates increase, and if taxes increase c. increase, if people expect prices to increase, if interest rates increase, and if taxes decrease d. decrease, if people expect prices to decrease, if interest rates decrease, and if taxes decrease e. decrease, if people expect prices to increase, if interest rates increase, and if taxes decrease
Define the following terms and explain their importance to the study of macroeconomics:
a. velocity b. equation of exchange c. monetarism d. automatic stabilizer
At the profit-maximizing level of output,
a. marginal revenue equals average total cost. b. marginal revenue equals average variable cost. c. marginal revenue equals marginal cost. d. average revenue equals average total cost.
One In the News article titled "Funeral Giant Moves In on Small Rivals" reports that profit for a Houston-based funeral giant is 31 cents on every dollar versus a profit of 12 cents for the funeral industry in general. Such profits are most likely the result of
A. A downward shift in the production function. B. Economies of scale. C. Higher minimum average costs. D. Constant returns to scale.