Refer to the information provided in Figure 27.3 below to answer the question(s) that follow.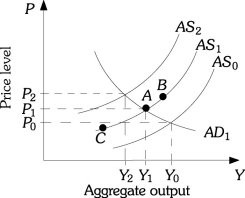 Figure 27.3Refer to Figure 27.3. The aggregate supply curve shifting from AS1 to AS2 will cause
A. hyperinflation.
B. demand-pull inflation.
C. deflation.
D. cost-push inflation.
Answer: D
You might also like to view...
The figure above illustrates the gasoline market. There is no external benefit from gasoline. If a tax on gasoline is imposed as shown in the figure, then the total tax revenue earned by the government equals
A) $24 million. B) $16 million. C) $8 million. D) more than $24 million. E) less than $8 million.
An increase in the money ________ shifts the LM curve to the ________, causing the interest rate to fall and output to rise, everything else held constant
A) demand; right B) demand; left C) supply; right D) supply; left
Very high inflation can arise when huge budget deficits are financed by the government printing its domestic currency. Which country experienced inflation of several million percent in 2008 as a result of this problem?
a. Myanmar b. Ukraine c. Zimbabwe d. Belarus
So we can see that an increase in government spending will raise the level of economic equilibrium, while a decrease in government spending will lower it
What will be an ideal response?