Exhibit 1A-2 Straight line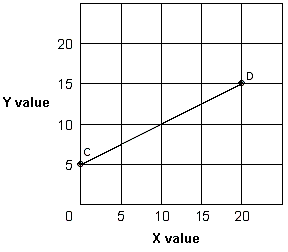
In Exhibit 1A-2, explain the slope of straight line CD.
A. As the X value increases by 20, the Y value increases by 5, so the slope is 4.
B. As the Y value increases by 5, the X value increases by 20, so the slope is 1/4.
C. As the X value increases by 10, the Y value increases by 5, so the slope is 2.
D. As the Y value increases by 5, the X value increases by 10, so the slope is 1/2.
Answer: D
You might also like to view...
The above figure shows the market for game day t-shirts. If the price of t-shirts is $10, then
A) there is a surplus and the price of t-shirts will fall. B) there is a shortage and the price of t-shirts will fall. C) there is a shortage and the price of t-shirts will rise. D) there is a surplus and the price of t-shirts will rise. E) the market is in equilibrium.
If a potato farmer expands output, he finds that the increase in total revenue is less than the increase in total costs. This means that:
a. profit is being maximized. b. he should not have expanded output. c. he should produce even more output. d. the firm is wasting resources. e. the farmer should go out of business.
Which of the following could cause the supply curve of labor to shift to the right?
a. an increase in wealth b. a decrease in population c. a decrease in wages d. an increase in employment opportunities e. an increase in the wage rate
Equilibrium GDP in excess of potential GDP eventually will cause the aggregate
a. demand curve to shift outward. b. supply curve to shift outward. c. supply curve to shift inward. d. demand curve to become flatter.