Refer to the diagram below for the milk market. If the price were $2 per gallon, then there would be a:
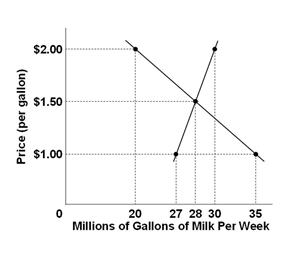
A. Shortage of 20 million gallons
B. Shortage of 10 million gallons
C. Surplus of 10 million gallons
D. Surplus of 30 million gallons
Answer: C
You might also like to view...
If absolute property rights to an endangered resource are granted to someone who inefficiently manages the resource, explain what the Coase theorem predicts will happen to that resource
What will be an ideal response?
The demand curve for a firm’s product is also the curve showing
A. total revenue. B. marginal revenue. C. average revenue. D. average profits.
Assume that you know the following cost information about Fred's widget company: Its fixed cost is $9, and its total variable cost is $6 for 1 unit; $11 for 2; $ 15 for 3; 20 for 4; and 26 for 5 . Given the above information, a. the marginal cost of the third unit is greater than the marginal cost of the first unit. b. the marginal cost of the fourth unit is the same as the marginal cost of the
second unit. c. the average variable cost of four units is the same as for three units. d. both (b) and (c) are correct.
Liquidity refers to the ability of an asset to hold its value in periods of inflation
a. True b. False Indicate whether the statement is true or false