Use the graph to answer the question. Mike decides to buy shares of companies A, B, and C, which were initially selling for the same price. The changes in each stock's value are shown in the graph above. After how many days did stock C's value go below
A. 60
B. 80
C. 40
D. 30
Answer: A
You might also like to view...
Solve the problem.In the weighted voting system  , the largest possible value that the quota q can take is
A. 15. B. 29. C. 22. D. 30. E. none of these
Solve the problem.Use the graph of the two linear functions W(t) and M(t) below to answer the questions that follow. The graph shows the speed at which the record times in the marathon were run by women and men in the years since 1991. i)For what value(s) of t is W(t) = M(t)? What does your result mean in terms of the situation?ii) For what value(s) of T is W(t) > M(t)? What does your result mean in terms of the situation?
What will be an ideal response?
Find the real solutions of the equation. = 9
= 9
A. {79} B. {81} C. {121} D. {83}
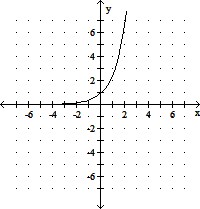
Graph the function.Use the graph of f(x) = ex to obtain the graph of g(x) =  ex.
ex.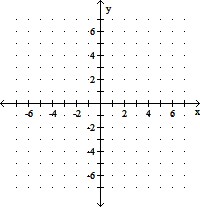
A. 
B. 
C. 
D.