Explain the relationship displayed on the graph based on a risk level of X. Use the other capital letters on the graph to identify: (a) the average expected return for a risk-free asset; (b) the average expected return for a market portfolio with a risk level of X; (c) the compensation for time preference for a risk-free asset; and (d) the risk premium for the market portfolio’s risk level of X.
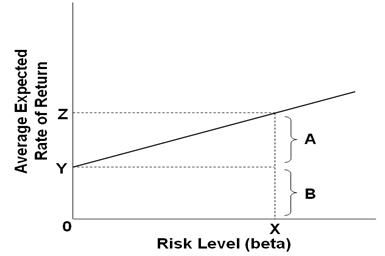
This graph represents the security market line. The security market line displays the relationship between the expected rate of return and the risk level. As the graph shows, the expected rate of return increases as the risk level increases. (a) Y; (b) Z; (c) B; (d) A
You might also like to view...
In the long run, a monopolistically competitive firm's price equals
A) its average total cost and its marginal cost. B) its average total cost but not its marginal cost. C) its marginal cost but not its average total cost. D) neither marginal cost nor its average total cost.
The free-rider problem occurs because
A) people who pay for information use it freely. B) people who do not pay for information use it. C) information can never be sold at any price. D) it is never profitable to produce information.
Which of the following would most likely occur if the federal government increased its spending and enlarged the size of the budget deficit during a period of full employment?
a. The rate of inflation would decline. b. The r ate of inflation would rise. c. A recession would develop. d. Interest rates would fall.
Entrepreneurs create destruction
Indicate whether the statement is true or false