Solve the problem.The following data represents the number of employees at a company at the start of each year since the company began. 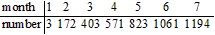 Find the slope of the line of best fit for the data set and interpret it.
What will be an ideal response?
The slope is about 206.1 which means that the number of employees is increasing by about 206 employees each year.
Mathematics
You might also like to view...
Evaluate the expression for the given values. If necessary, round to the nearest tenth. x = 9, y = 2
A. 
B. 
C. 
D. 
Mathematics
Solve the problem.The sum of two numbers is 44 and their difference is 14. Find the numbers.
A. 31 and 13 B. 31 and 45 C. 13 and 31 D. 15 and 29
Mathematics
Find the probability.A digit is chosen randomly from the digits 0 through 9 and then 6 is added to the digit and the sum recorded. Find the probability that the sum is 1.
A. 
B. 
C. 0
D. 
Mathematics
Graph the ellipse.36x2 + y2 - 144x + 108 = 0
A. 
B. 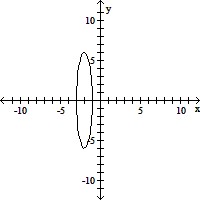
C. 
D. 
Mathematics