Analyze the graph of the given function f as follows:(a) Determine the end behavior: find the power function that the graph of f resembles for large values of |x|.(b) Find the x- and y-intercepts of the graph.(c) Determine whether the graph crosses or touches the x-axis at each x-intercept.(d) Graph f using a graphing utility.(e) Use the graph to determine the local maxima and local minima, if any exist. Round turning points to two decimal places.(f) Use the information obtained in (a) - (e) to draw a complete graph of f by hand. Label all intercepts and turning points.(g) Find the domain of f. Use the graph to find the range of f.(h) Use the graph to determine where f is increasing and where f is decreasing.f(x) = x2(x2 - 4)(x + 4)
What will be an ideal response?
(a) For large values of |x|, the graph of f(x) will resemble the graph of y = x5.
(b) y-intercept: (0, 0), x-intercepts: (-4, 0) , (-2, 0), (0, 0), and (2, 0)
(c) The graph of f crosses the x-axis at (-4, 0), (-2, 0), and (2, 0) and touches the x-axis at (0, 0).
(e) Local maxima at (-3.35, 52.69) and (0,0); Local minima at (-1.31, -10.54) and (1.46, -21.75)
(f) 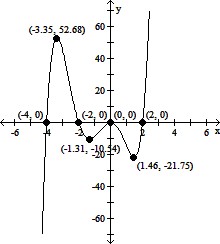
(g) Domain of f: all real numbers; range of f: all real numbers
(h) f is increasing on (-?, -3.35), (-1.31, 0), and (1.46, ?); f is decreasing on (-3.35, -1.31) and 
You might also like to view...
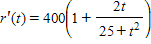
The population of a certain city is projected to grow at the rate of
?
?

?
people/year, t years from now. The current population is 60,000. What will be the population 5 years from now?
?
__________ people
Fill in the blank(s) with the appropriate word(s).
Find the equation of the parabola with vertex at  and focus at
  . Express the equation in standard form.
What will be an ideal response?
Solve the problem.x varies inversely as y2, and x = 6 when y = 10. Find x when y = 2.
A. x = 180 B. x = 24 C. x = 5 D. x = 150
Write the fraction or mixed number as a percent.
A. 35%
B. 2 %
%
C. 3 %
%
D. 28 %
%