Refer to the figure below.________ inflation will eventually move the economy pictured in the diagram from short-run equilibrium at point ________ to long-run equilibrium at point ________, 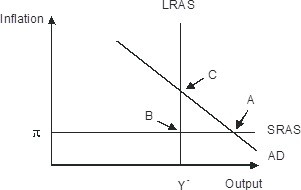
A. Rising; B; C
B. Falling; A; C
C. Falling; A; B
D. Rising; A; C
Answer: D
You might also like to view...
Any efficient allocation of public goods will be such that the sum of the marginal benefits is equal to the marginal cost -- but the level of the public good may differ depending on how income is distributed in the population.
Answer the following statement true (T) or false (F)
An increase in ________ shifts the production function ________, and makes it possible to produce a higher level of GDP with ________ capital per hour worked
A) technology; down; the same amount of B) consumption; up; a lesser amount C) technology; up; the same amount of D) labor productivity; down; the same amount of
If hiring one more worker causes the average product of labor to fall, then:
A. the marginal product of labor is less than the average product of labor. B. the marginal product of labor is equal to the average product of labor. C. the marginal product of labor is greater than the average product of labor. D. the marginal product of labor is negative.
If the marginal propensity to consume (MPC) is 0.80, and if policy makers wish to increase real GDP $200 billion, then by how much would they have to change taxes?
A. ?$240 million. B. ?$200 million. C. ?$180 million. D. ?$50 million.