Use the following graphs to answer the next question.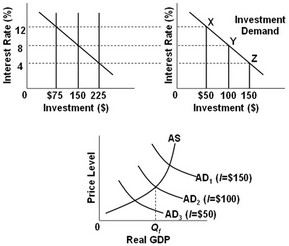 In the graphs, the numbers in parentheses near the AD1, AD2, and AD3 labels indicate the levels of investment spending associated with each curve. All figures are in billions. What is the desired level of investment spending in this economy if the goal is to achieve a noninflationary, full-employment level of real GDP?
A. $100 billion
B. $225 billion
C. $150 billion
D. $50 billion
Answer: A
You might also like to view...
The Bretton Woods system was expected to be more stable than the gold standard because
A) the world supply of gold had increased greatly by the time the Bretton Woods system was established. B) large trade deficits and surpluses would be unlikely to occur under the Bretton Woods system. C) fewer countries were involved in the Bretton Woods system than had been involved in the gold standard. D) the IMF was set up to be a lender of last resort.
The demand for labor curve is identical to the:
a. total wage cost curve. b. marginal resource curve. c. total revenue curve. d. marginal revenue product curve. e. marginal revenue curve.
Data on the income of law graduates collected at different times during the same year is _____.
A. panel data B. experimental data C. time series data D. cross-sectional data
Exhibit 7-10 Price and cost data for a firm Q P AVC ATC MC 0 $12 ? ? ? 1 12 3 5 5 2 12 5 6 7 3 12 7.3 8 12 4 12 9.5 10 16 In Exhibit 7-10, following the rule regarding MR and MC, the most profitable output level is:
A. 1. B. 2. C. 3. D. 4.