Refer to Figure 26-10. In the figure above, suppose the economy is initially at point A. The movement of the economy to point B as shown in the graph illustrates the effect of which of the following policy actions by the Federal Reserve?
A) an open market purchase of Treasury bills B) a decrease in the required reserve ratio
C) an open market sale of Treasury bills D) an increase in income taxes
C
You might also like to view...
One of the benefits of the Hay System is that it can be used to
A. assign a task to each employee on the basis of seniority. B. determine the level of compensating wage differentials in risky jobs. C. determine the optimal mix of salary and fringe benefits. D. assign a position to each job within a firm's hierarchy.
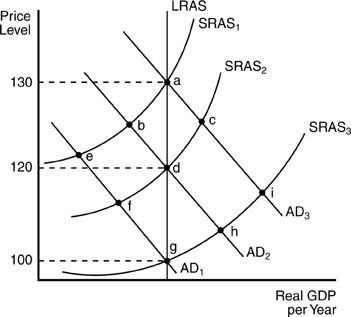 In the above figure, assume the economy starts out in equilibrium at point d. If the Fed increases the money supply so that the new aggregate demand curve is AD3, then the new short-run equilibrium will be at point
A. a. B. b. C. c. D. i.
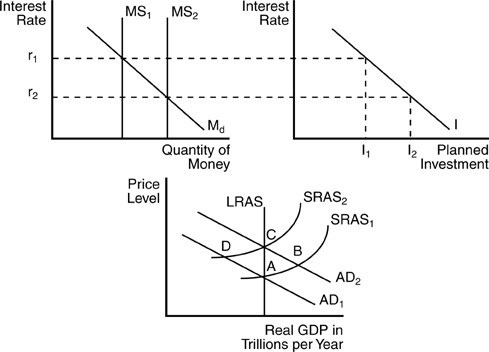 In the above figure, if the economy is initially at an equilibrium output at point A and the interest rate is r1, then an open market purchase of bonds by the Fed will
A. cause interest rates to increase and output to decline. B. cause interest rates to decline to r2, investment to increase to I2, and the AD curve to shift upward to the right. C. not have any impact on short- or long-run equilibrium real Gross Domestic Product (GDP). D. cause interest rates to decline to r2, investment to decline, and aggregate demand to shift inward to the left.
Refer to the information provided in Figure 2.4 below to answer the question(s) that follow.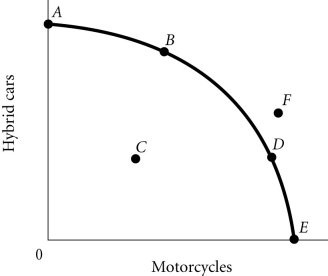 Figure 2.4According to Figure 2.4, Point E necessarily represents
A. only motorcycles being produced. B. overallocation of resources. C. an impossible production point. D. technological advancement.