Use the given data to construct a frequency and relative frequency distribution.A car insurance company conducted a survey to find out how many car accidents people had been involved in. They selected a sample of 32 adults between the ages of 30 and 70 and asked each person how many accidents they had been involved in in the past ten years. The following data were obtained.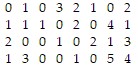 Construct a frequency and relative frequency distribution using classes based on a single value.
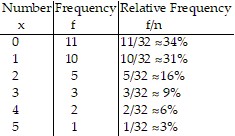
A.
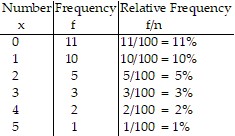
B.
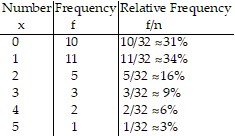
C.
D.
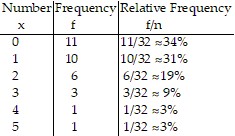
Answer: A
Mathematics
You might also like to view...
Find the unknown length in the right triangle. If necessary, approximate the length to the nearest thousandth.
A. 8.124 cm B. 7.483 cm C. 10.296 cm D. 14 cm
Mathematics
Determine whether the given equation is an identity. + 8 =
+ 8 =  - 1 -
- 1 -  + 9
+ 9
A. Yes B. No
Mathematics
Solve the problem.In a football game, the quarterback throws a pass from the 23-yard line, 19 yards from the sideline. The pass is caught on the 26-yard line, 15 yards from the same sideline. How long was the pass? (Assume the pass and the reception are on the same side of midfield. Round your answer to the nearest tenth.)
A. 2.6 yards B. 13.6 yards C. 5 yards D. 1 yards
Mathematics
Simplify the exponential expression.
A. y10
B. 
C. 
D. 
Mathematics