Solve.Suppose that a polynomial function is used to model the data shown in the graph below.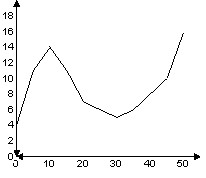 Determine the degree of the polynomial function of best fit and the sign of the leading coefficient.
A. Degree 4; positive leading coefficient.
B. Degree 3; positive leading coefficient.
C. Degree 4; negative leading coefficient.
D. Degree 3; negative leading coefficient.
Answer: B
You might also like to view...
Find the area of the figure. Use 3.14 for ?. Round approximations to the nearest tenth. a = 4 ft
A. 9.4 ft2 B. 67.0 ft2 C. 37.7 ft2 D. 18.8 ft2
Rationalize the denominator. Simplify, if possible.
A. 
B. 
C. 
D. 
Tell whether the expression is a monomial. If it is, name the variable(s) and coefficient, and give the degree of the monomial.-8x6
A. Monomial; variable x; coefficient -8; degree 6 B. Monomial; variable x; coefficient 6; degree 0 C. Monomial; variable x; coefficient 6; degree -8 D. Not a monomial
Write the equation of the line with the given slope and y-intercept.m = -4, b = 9
A. y = -4x + 9 B. y = -9x + 4 C. y = 4x - 9 D. y = 9x - 4