Use the following graph of the demand for pasta to answer the question below.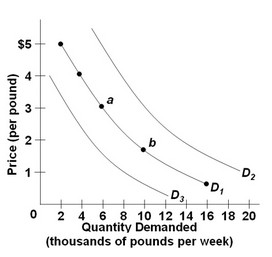 Refer to the three demand curves for pasta and assume that pasta is an inferior good. Which of the following would shift the demand for pasta from D1 to D3?
A. an increase in the price of pasta
B. a decrease in consumer incomes
C. an increase in consumer incomes
D. a decrease in the price of pasta
Answer: C
You might also like to view...
Suppose the marginal propensity to consume (MPC) equals 0.80, an increase in autonomous investment of $100 will lead to an increase in real Gross Domestic Product (GDP) by
A) $100. B) $400. C) $500. D) $800.
Steps taken to clean the environment may lead to
A. overproduction. B. higher prices. C. higher incomes. D. higher profits.
Which is the most accurate statement?
A. Workfare has been a great success in moving millions of people off the welfare rolls into minimum wage jobs. B. Most people on welfare are now limited to receiving benefits for no more than 5 years during their entire adult lives. C. The Personal Responsibility and Work Opportunity Act of 1996 provides jobs or training for every adult who desires to leave welfare. D. Until the passage of welfare legislation in 1996, the welfare rolls had been rising for the previous 6 years.
Nominal GDP is proportional to money stock when
A. velocity of money is volatile. B. velocity of money is constant. C. there are major changes in the value of velocity of money. D. velocity of money is zero.