The aggregate demand curve shows total expenditures at different levels of national income
Indicate whether the statement is true or false
FALSE
You might also like to view...
The price of a gallon of gasoline was $0.35 in 1972 when the CPI equaled 0.418. The cost of a gallon of gasoline was $2.25 in 2005 when the CPI equaled 1.68. The real cost of a gallon of gasoline between 1972 and 2005:
A. may have either increased or decreased. B. remained constant. C. increased. D. decreased.
Recently a teachers' union argued that the standard of living of teachers working for the school district was falling. The negotiating team for the school board replied that this was not true because the teachers had received significant increases in nominal income through collective bargaining. Could the union statement be correct?
A. Yes, because real income may fall if price increases are proportionately smaller than the increases in nominal income. B. No, because real income may rise if price increases are proportionately greater than declines in nominal income. C. Yes, because real income may fall if price increases are proportionately greater than the increases in nominal income. D. No, because real income may rise if price increases are proportionately greater than the increases in nominal income.
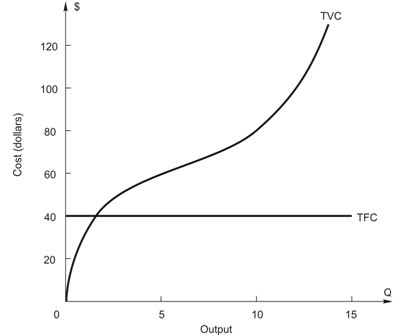 In the above figure, what is the TOTAL cost of producing 5 units of output?
A. $60 B. $100 C. $2,000 D. $225 E. $10
All of the following countries come close to the free market benchmark except
A) Canada. B) North Korea. C) Germany. D) Singapore.