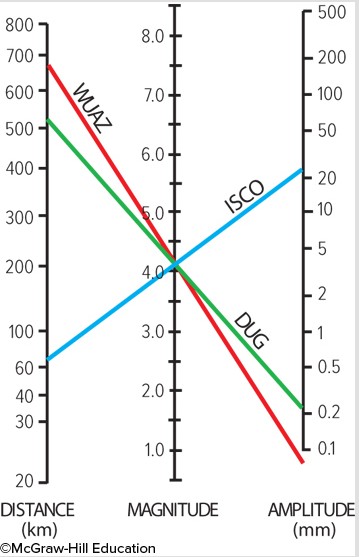
The diagram below shows data from a single earthquake plotted on a diagram that shows the mathematical relationship between distance, magnitude, and S-wave amplitude. What do these data show?
A. The distance between stations WUAZ and DUG is 680 km.
B. The local magnitude of the earthquake recorded by these three stations is 4.1 MI.
C. Station DUG was closest to the earthquake.
D. Station ISCO is 22 km from the earthquake epicenter.
Answer: B
You might also like to view...
The leader who conducted a nonviolent campaign for Indian independence in the 1900s was
A. Buddha B. Mahatma Gandhi C. Jawaharlal Nehru D. Mujahideen
A location on a windward coast refers to a place where the prevailing wind is:
A) away from land. B) toward the land. C) always light or calm. D) from the north. E) strong.
As the U.S. Manufacturing Belt came into being, which of the following cities arose?
A) New York B) Boston C) Philadelphia D) St. Louis E) Baltimore
The Sun emits its greatest intensity of radiation in the
a. visible portion of the spectrum. b. infrared portion of the spectrum. c. ultraviolet portion of the spectrum. d. x-ray portion of the spectrum. e. gamma ray portion of the spectrum.